Kirkland seeks community input on police use of force dashboard
Published 2:30 pm Tuesday, February 8, 2022
Kirkland is seeking community input regarding the police use of force dashboard, which makes the Kirkland Police Department’s use of force incidents from 2016 to 2020 available to the public.
The dashboard was one action called for in Resolution R-5434. It was adopted in August 2020 by the Kirkland City Council with the purpose of dismantling structured racism, and to ensure the safety and respect of Black people, according to the city.
Police Strategies LLC, a third-party vendor that provides data evaluation and analysis, created the dashboard after months of analysis of the Kirkland Police Department’s use of force incidents, in addition to community input and industry best practices.
“Following the tragic murder of George Floyd in 2020 and demand for action in Kirkland, the City Council committed to several strategies to increase transparency and accountability,” said Deputy Mayor Jay Arnold. “Publishing this draft use of force dashboard is one step of that effort, and I’m eager to explore the data to see what insights we can learn to inform potential changes in policy, programs, or processes. I encourage the community to engage with this new tool and give us your feedback about the preliminary dashboard and the data.”
Four tabs are located at the top of the dashboard and are titled “Dashboard Instructions,” “Day, Time & Location of Force Incidents,” “Subject Characteristics & Crimes Charged” and “Use of Force Tactics, Restraints & Injury Rates.”
The dashboard also lists the total number of use of force incidents from 2016 to 2020 — which is 286. Dashboard filters are provided and include year, subject gender, subject, race, subject age, subject home and force type.
Within the four tabs, data is broken down primarily by line graphs, bar graphs and pie charts. A pie chart located under the second tab, “Day, Time & Location of Force Incidents,” shows that 44% of use of force cases occurred on the street, while 23% occurred in businesses.
The “Subject Characteristics & Crimes Charged” tab shows that 83% of all subjects who experience police use of force were male. Another pie chart under that section shows that 60% of subjects were white, while 20% were Black, 12% were Hispanic and 7% were Asian.
A bar graph with subject conditions display that 45% of subjects were angry, 39% were had consumed alcohol or drugs, 24% were yelling, 21% were possibly armed, 19% were struggling with mental health and 7% were suicidal.
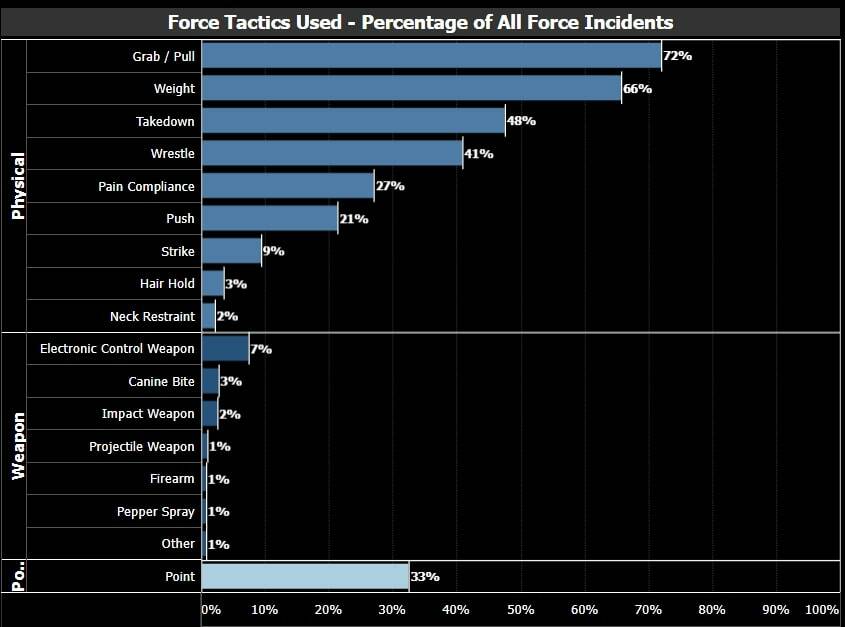
In the final tab, “Use of Force Tactics, Restraints & Injury Rates,” the types of force used, number of officers present, and officers using force are presented. Force tactics are broken down between physical and weapon, with physical use of force tactics being more prominent.
“Grab and pull” use of force tactics made up 72% of all cases. Weight made up 66% of cases, and takedown made up 48%. The most used weapon tactic was the use of an electronic control weapon (often referred to as a Taser), which made up 7% of all cases.
A section showing injury rates of both officers and subjects is included. However the graph neglects to mention the extent of the injuries for both.
The city of Kirkland welcomes feedback on the draft dashboard, with hopes of making the dashboard as effective as possible.
To view the graph and provide feedback, visit https://www.kirklandwa.gov/Government/Departments/Police-Department/Community-Resources/UOF-Dashboard